Illustration
Infographics and Process Maps
Infographic and process map illustrations designed to show complex ideas or processes in a simplified, easy to understand form.
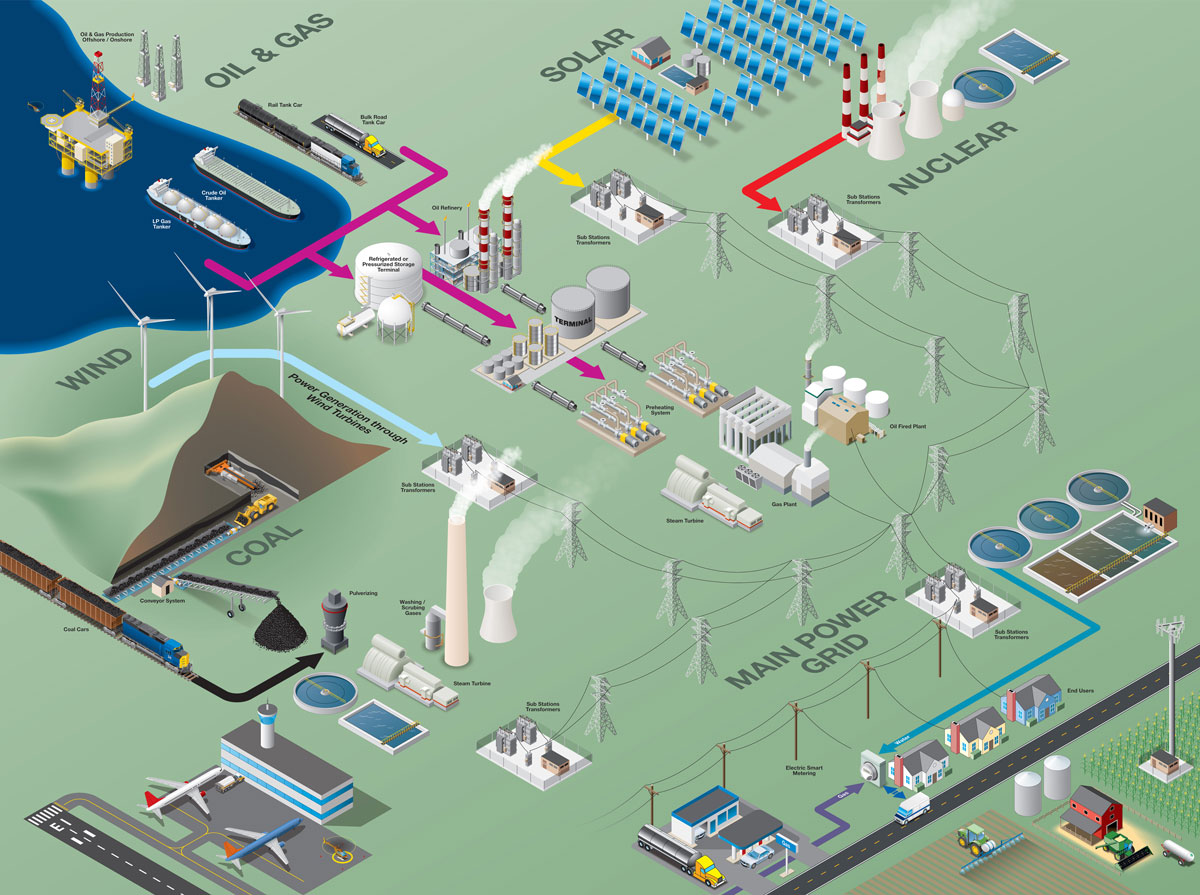
Isometric process map depicting the upstream and downstream components for the energy sector.
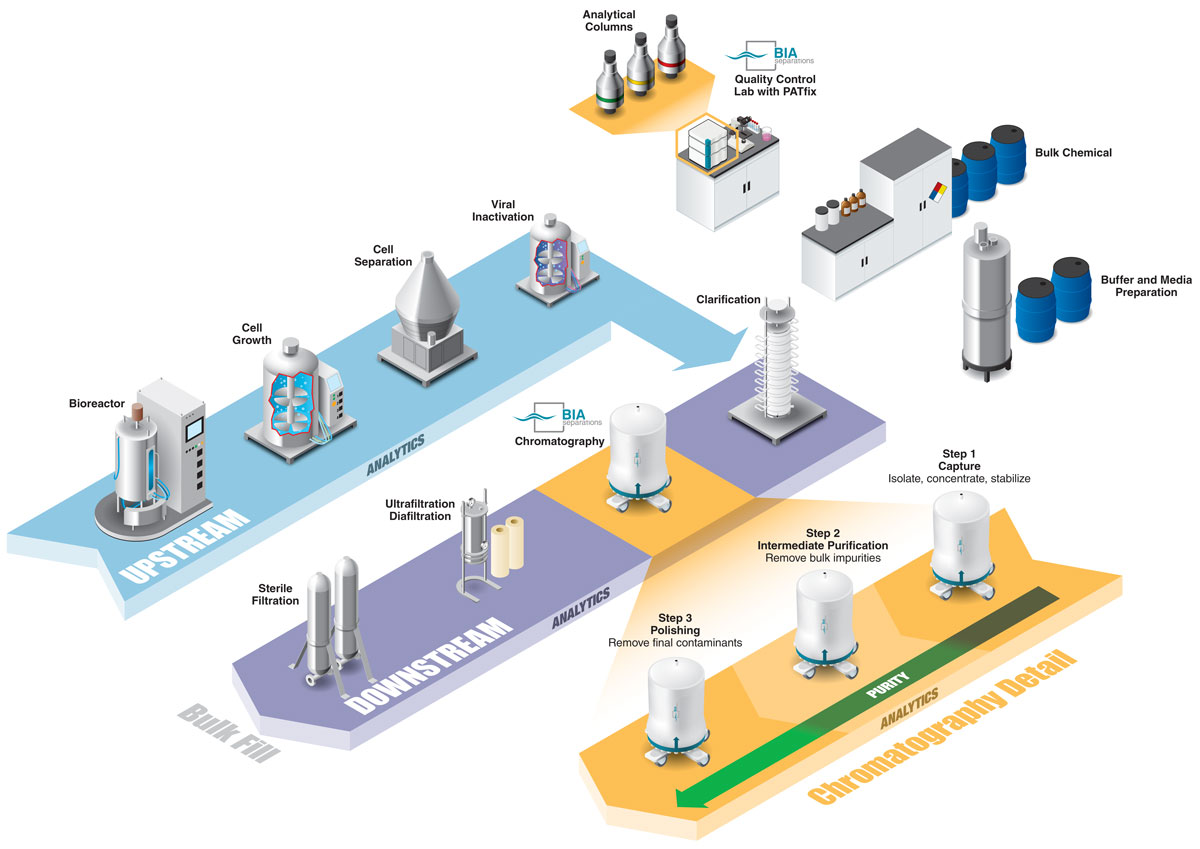
A process map showing the upstream and downstream parts used in chromatography.
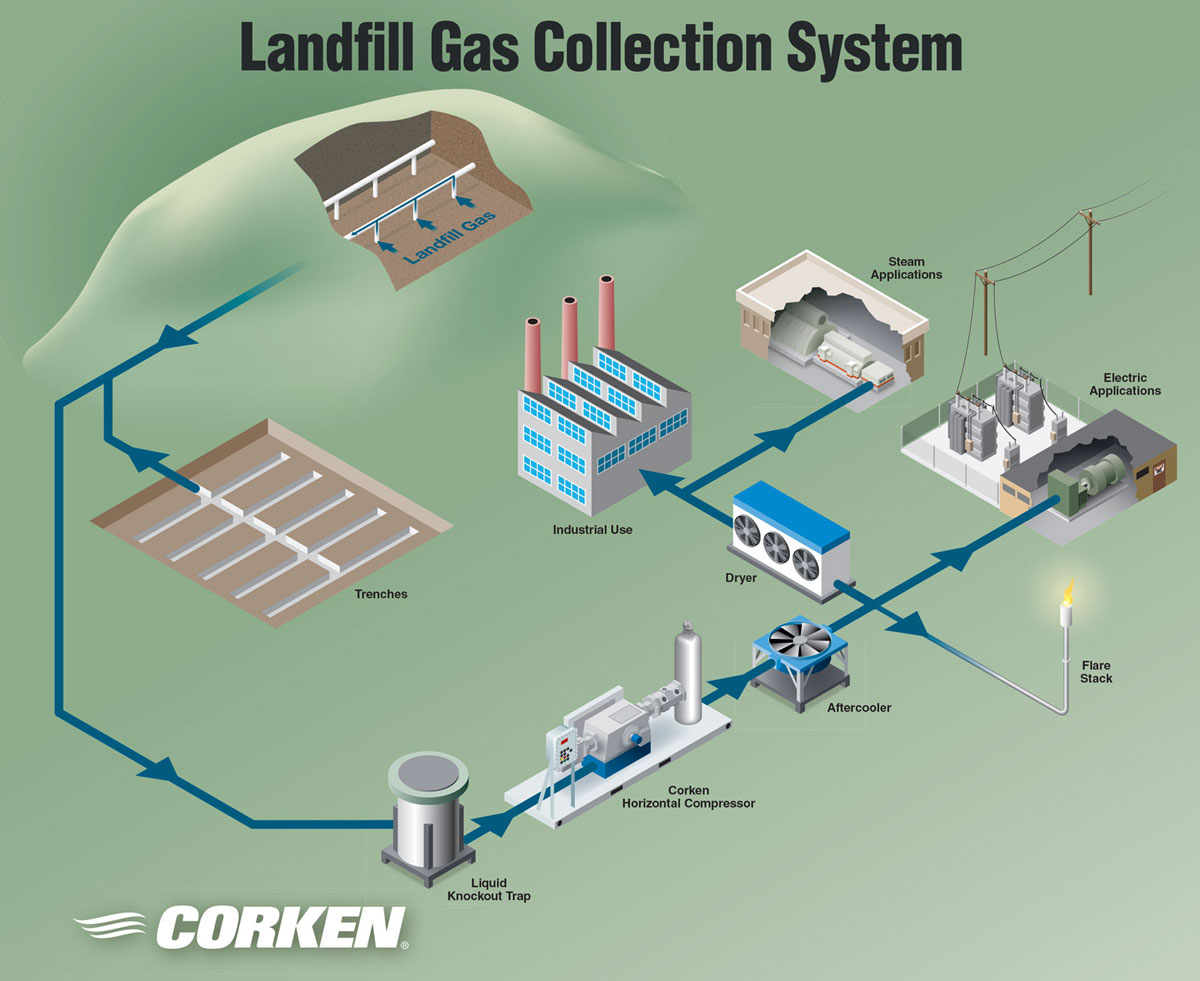
Isometric process map showing how landfills can capture and use sour gas.
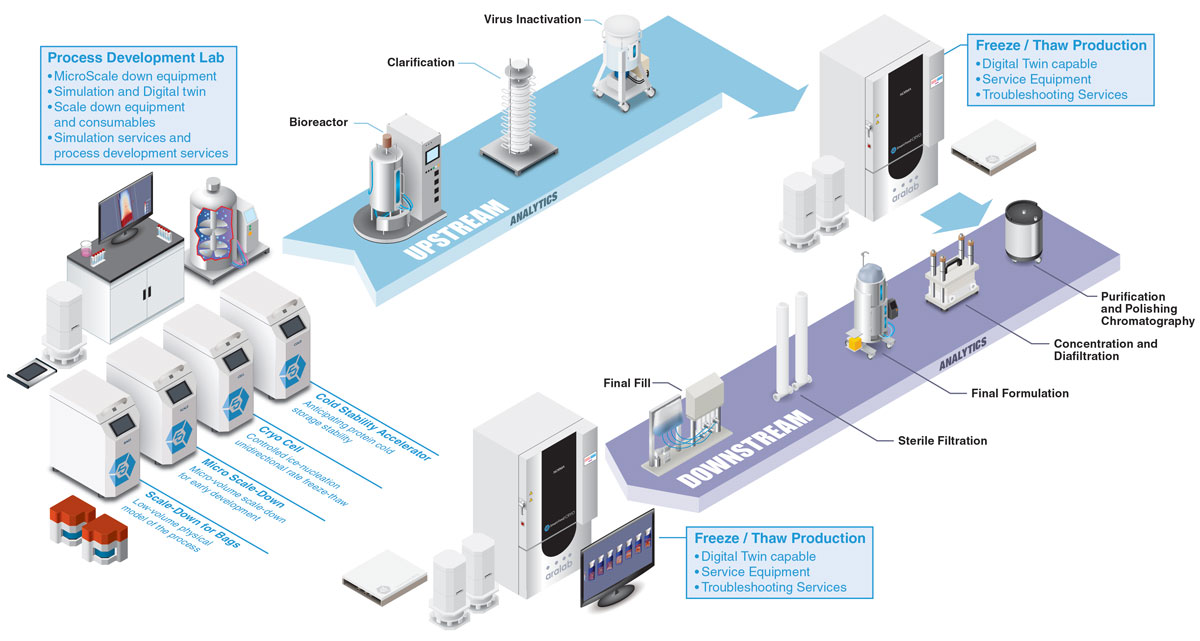
A process map depicting the upstream and downstream steps involved with laboratory processes.
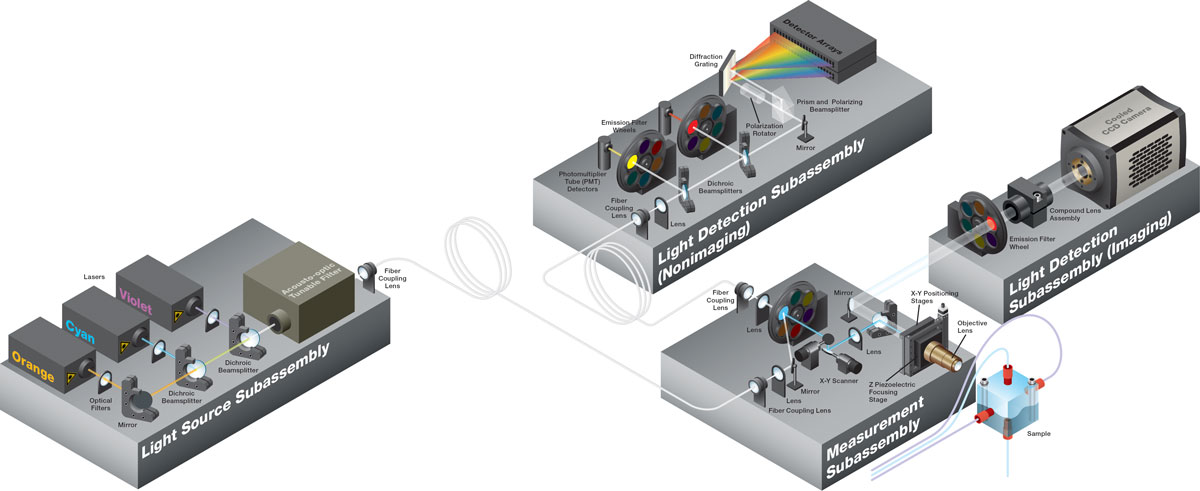
Process map showing the various components used in an optical assembly.
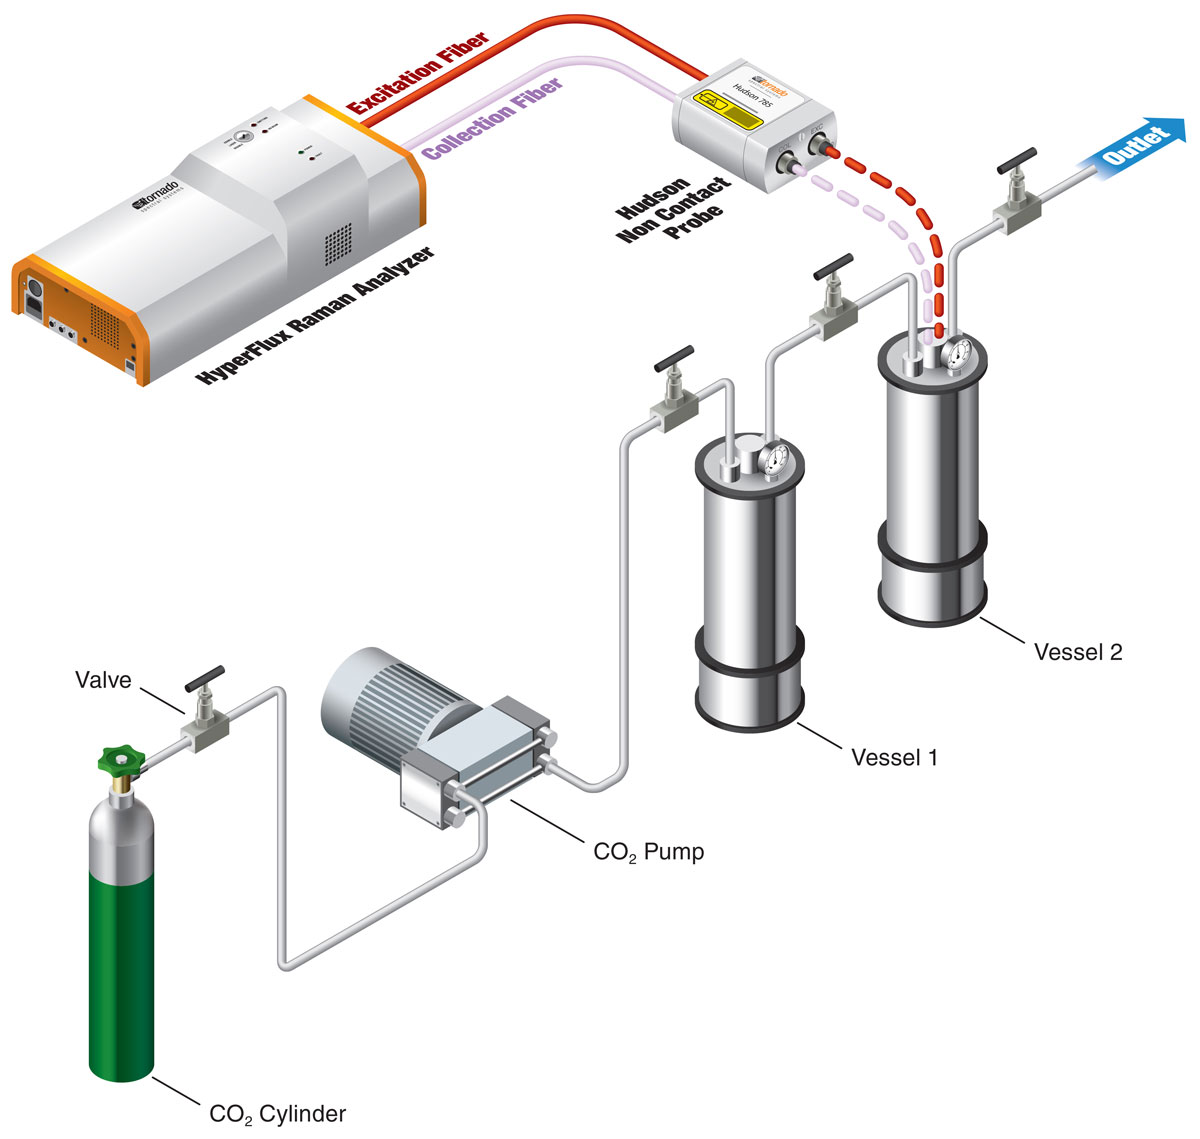
Process map depicting how different devices are used in CBD extraction.
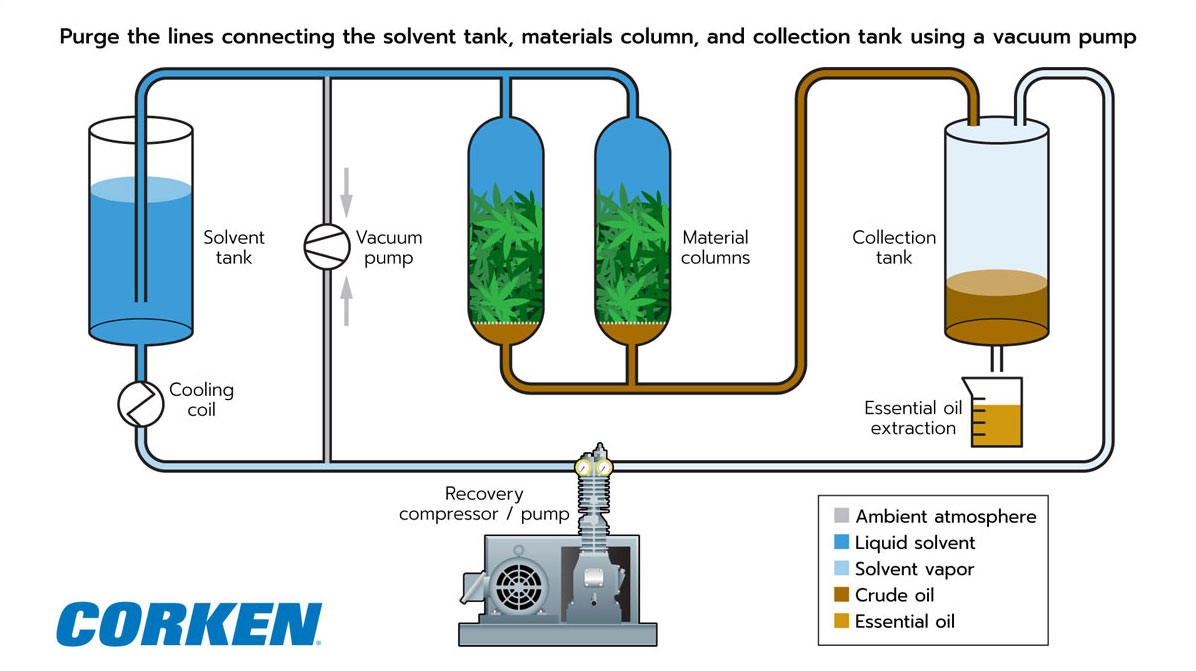
Process map showing the steps involved in CBD oil extraction.
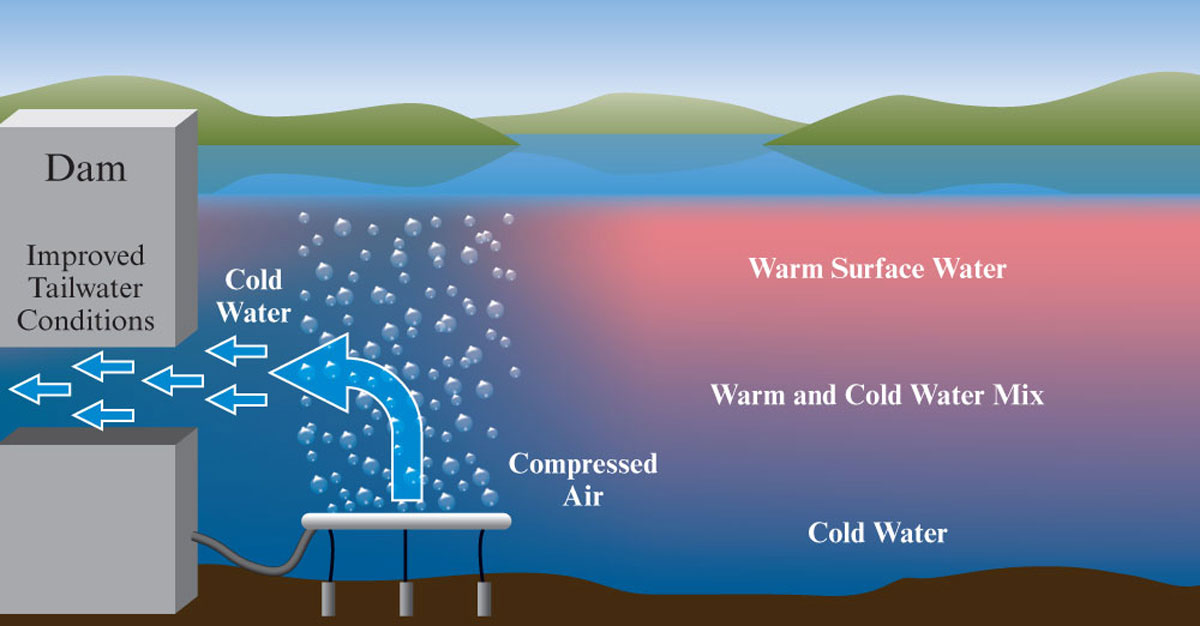
A process map showing how a bubble diffuser can be used to cool reservoir water.
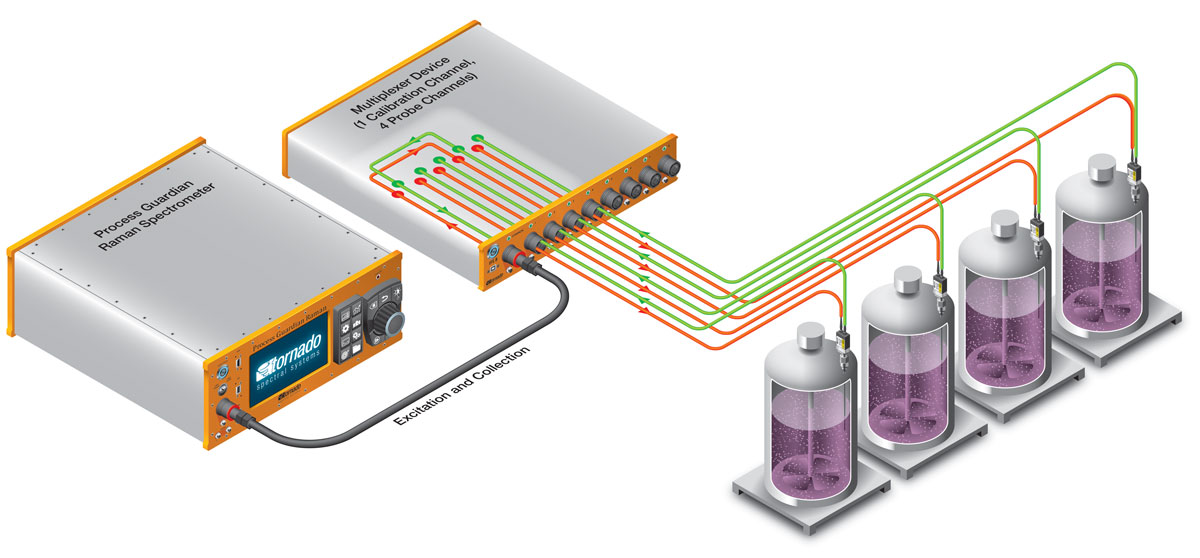
Process map showing how fiberoptics are used for an optical analyzer.
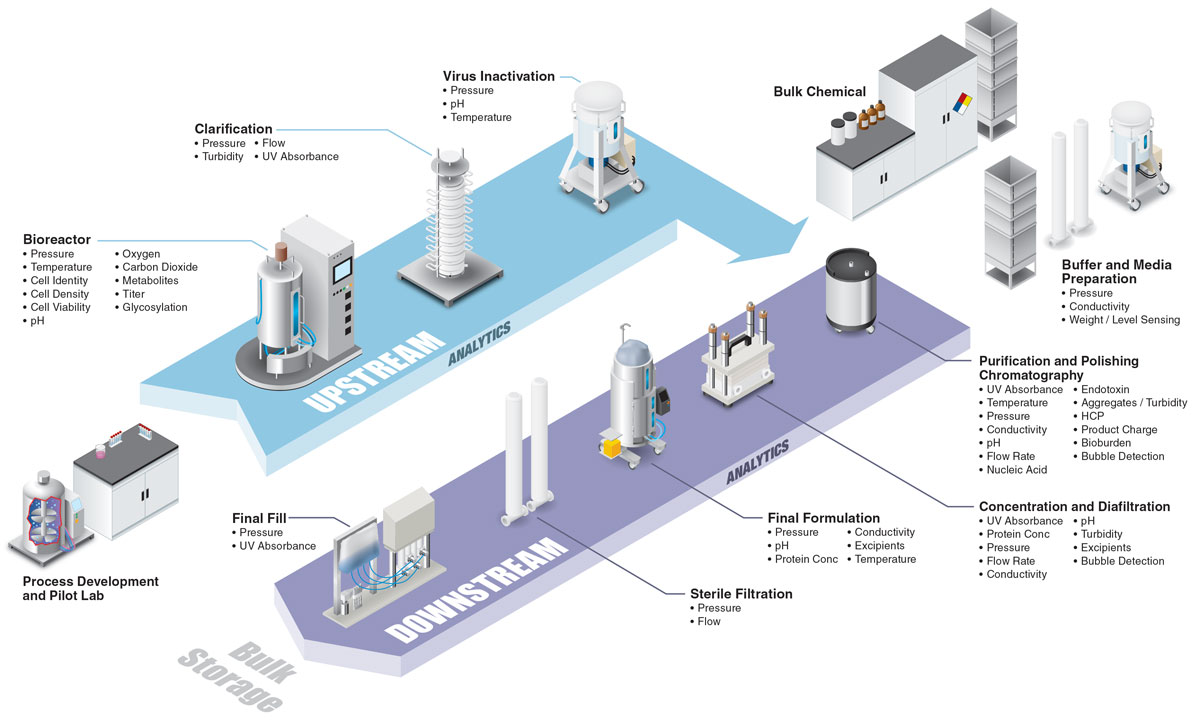
Isometric process map showing where laboratory single-use sensors are used upstream and downstream.
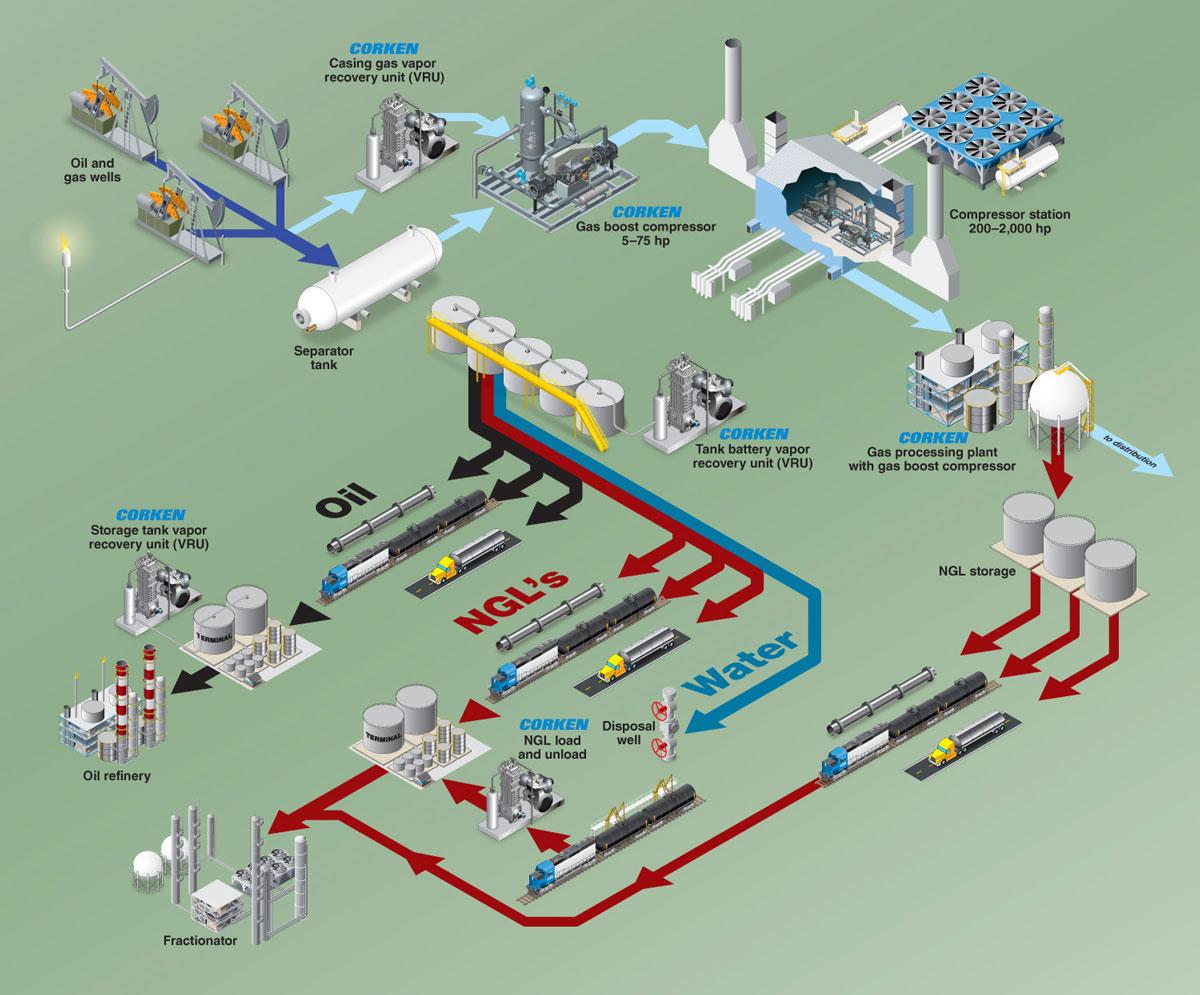
Process map showing the steps involved in upstream oil and gas production.
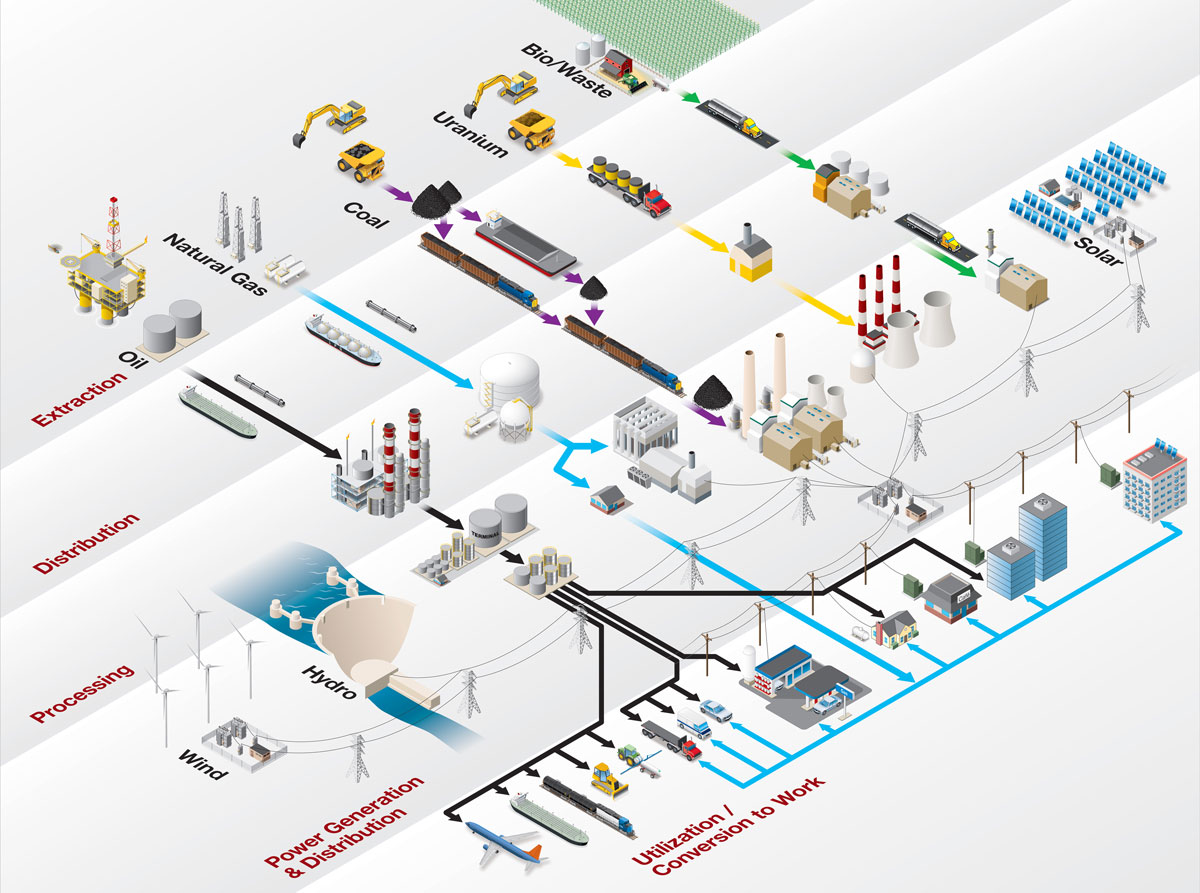
Process map showing the different segments of the energy industry.
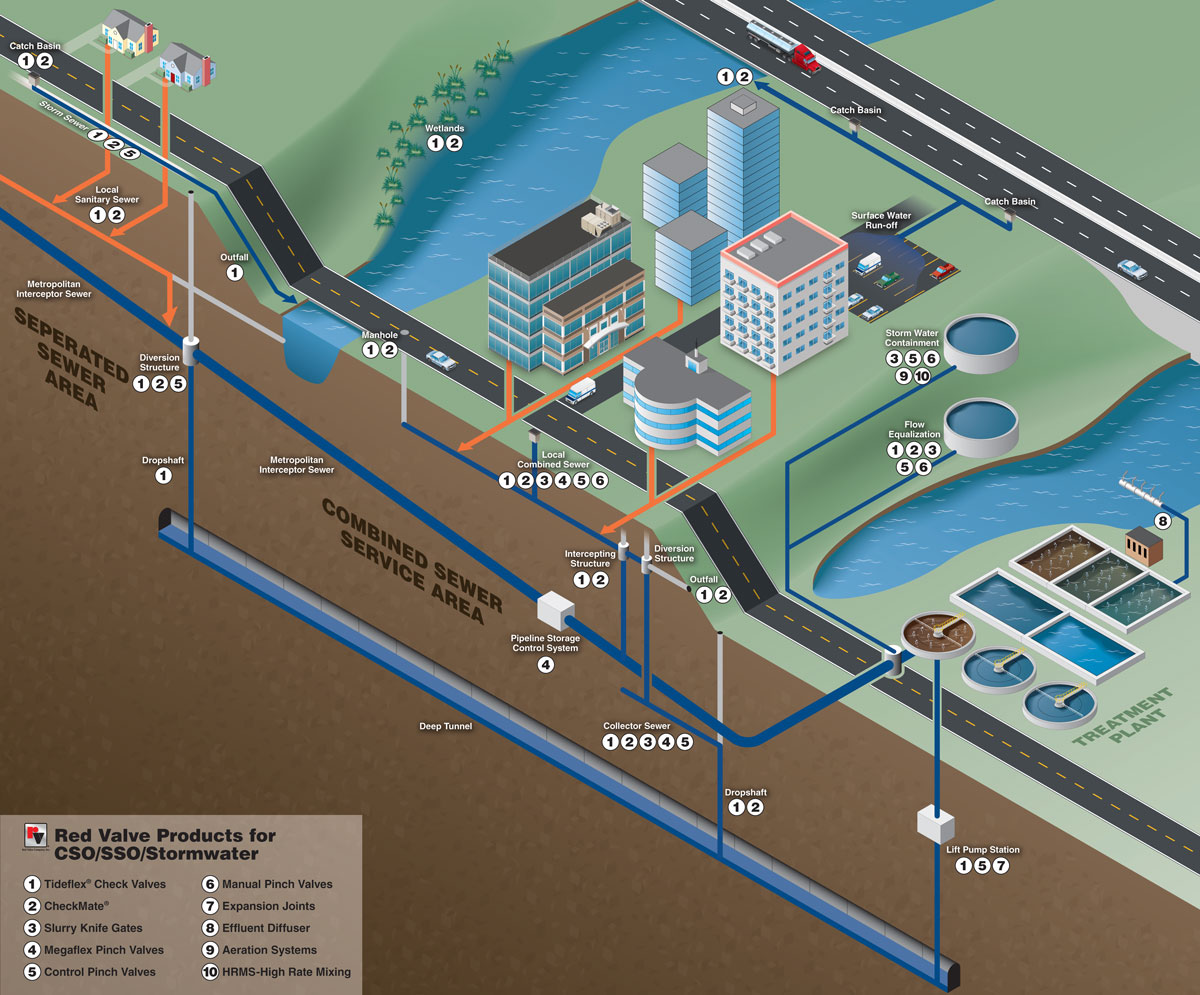
Process map showing a typical city's storm water flow.
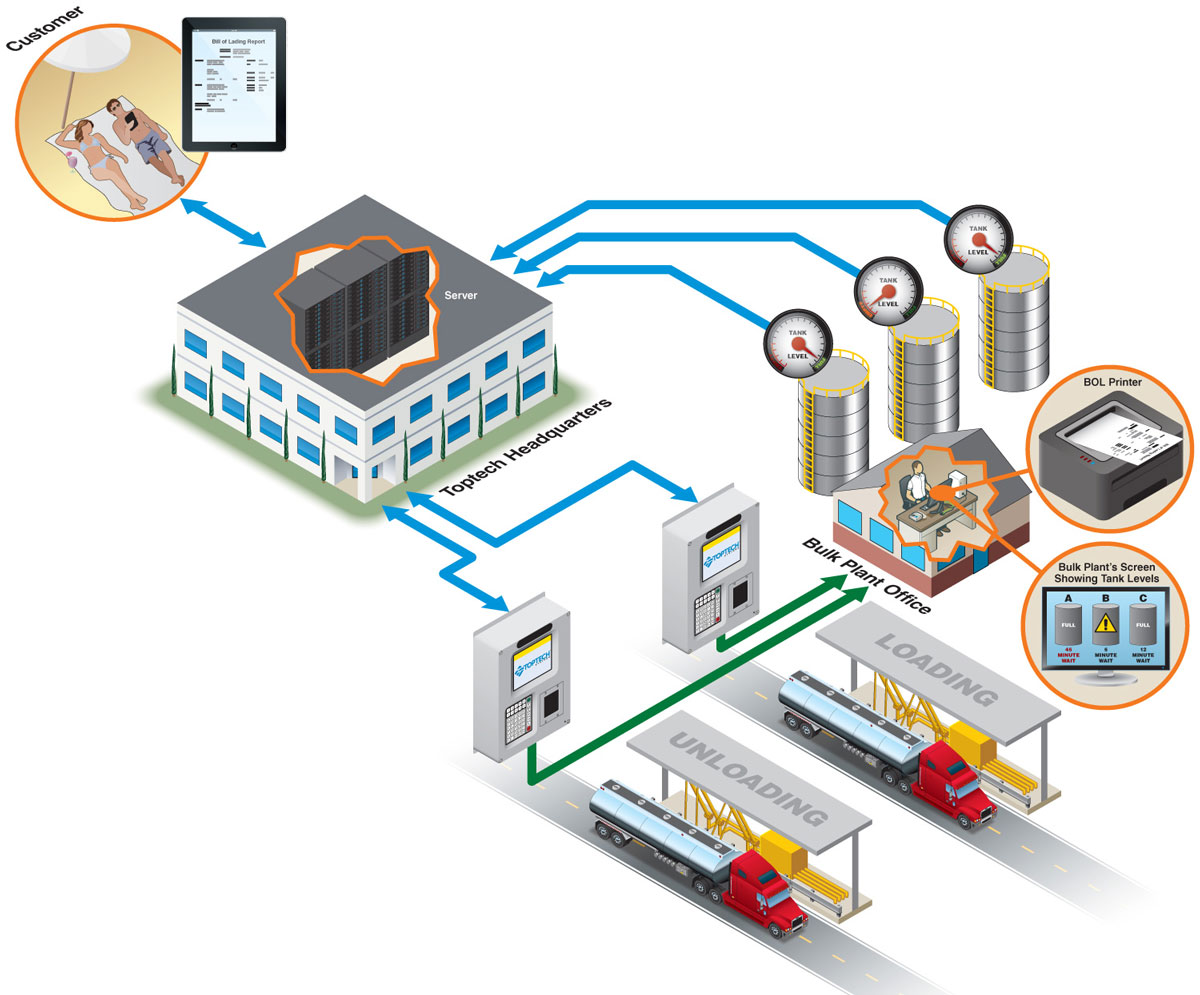
Process map showing how fuel truck loading and unloading can be monitored.